

Deri Hughes is a private investor and former parliamentary assistant.
The Conservative Party’s energy policy has come a long way very quickly.
For fourteen years, it governed as though Ed Miliband had never left the building. Now that the Colossus of Doncaster is formally back in charge of the energy brief, the Conservative leadership has decided that a change of policy is required; and a marked one at that. They should be commended for the clarity of their perception and the strength of their resolve.
It is worth taking some time to reflect on why the Conservative Party (and Reform) have chosen to break with the energy policy consensus of the last twenty years. They have certainly not done so on a whim.
Electricity prices are especially salient in discussions of energy policy, and they provide the principal focus for this article. It should be stressed that the burden of policy is not confined solely to the electricity market, but it is most apparent and acute there.
The following chart shows average prices of selected energy sources in Britain, Japan and Texas in April to June 2025. Texas is renowned for cheap energy, which makes for an interesting comparison with Britain. Japan is certainly not renowned for cheap energy. It makes for an equally interesting but very different comparison. VAT (or equivalent) is excluded, as are the subsidies that were paid to Japanese consumers.
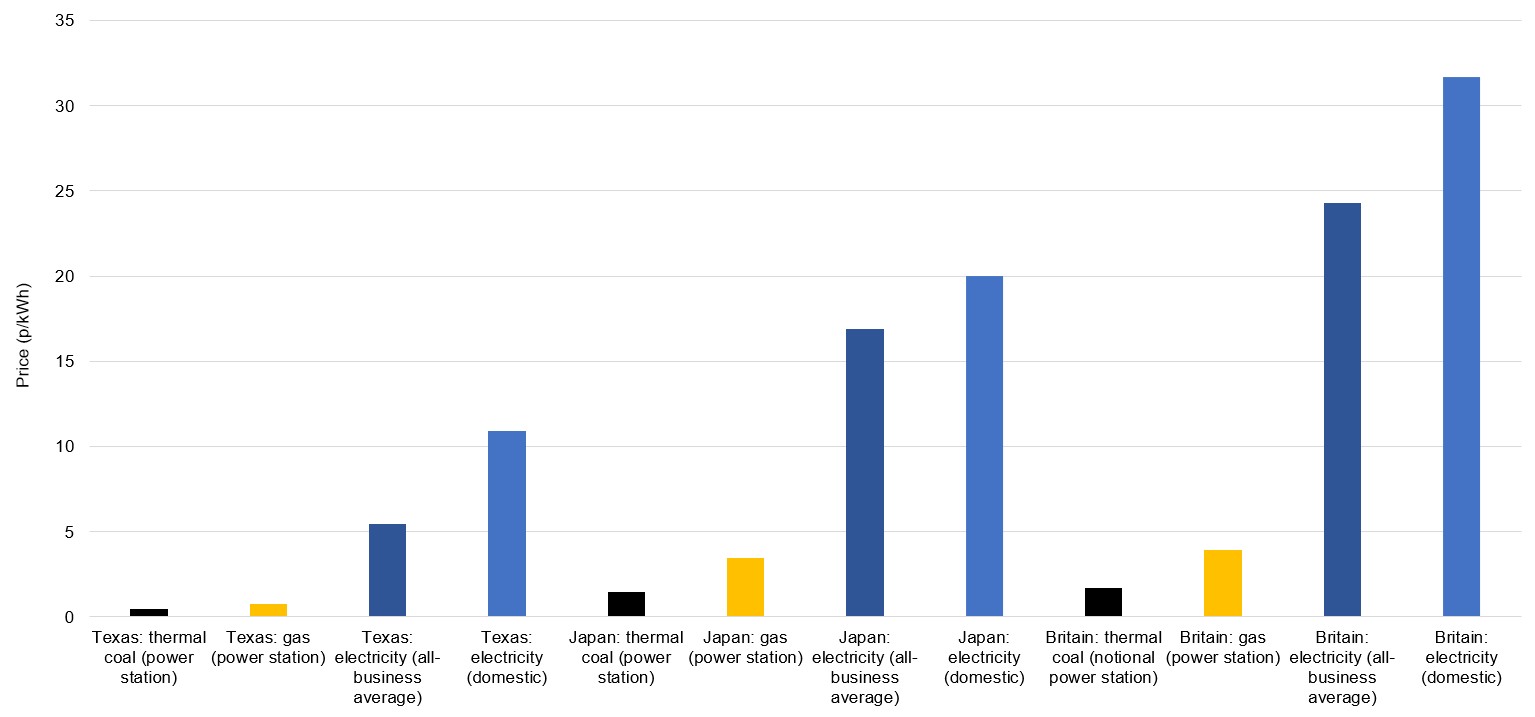
The magnitude of British electricity prices is readily apparent. The average price paid by British businesses is more than four times greater than that for their Texan counterparts; and more than double the price paid by Texan households. The gap between prices in Britain and Japan is less stark, but is substantial nevertheless; British businesses pay over 40% more than their Japanese counterparts.
British electricity prices have not always been so high. Indeed, there was a time, a little over twenty years ago, when they were quite competitive.
The following chart shows the average price paid between 1921 and 2024. The underlying prices have been adjusted for inflation, and are shown in 2024 equivalent prices.
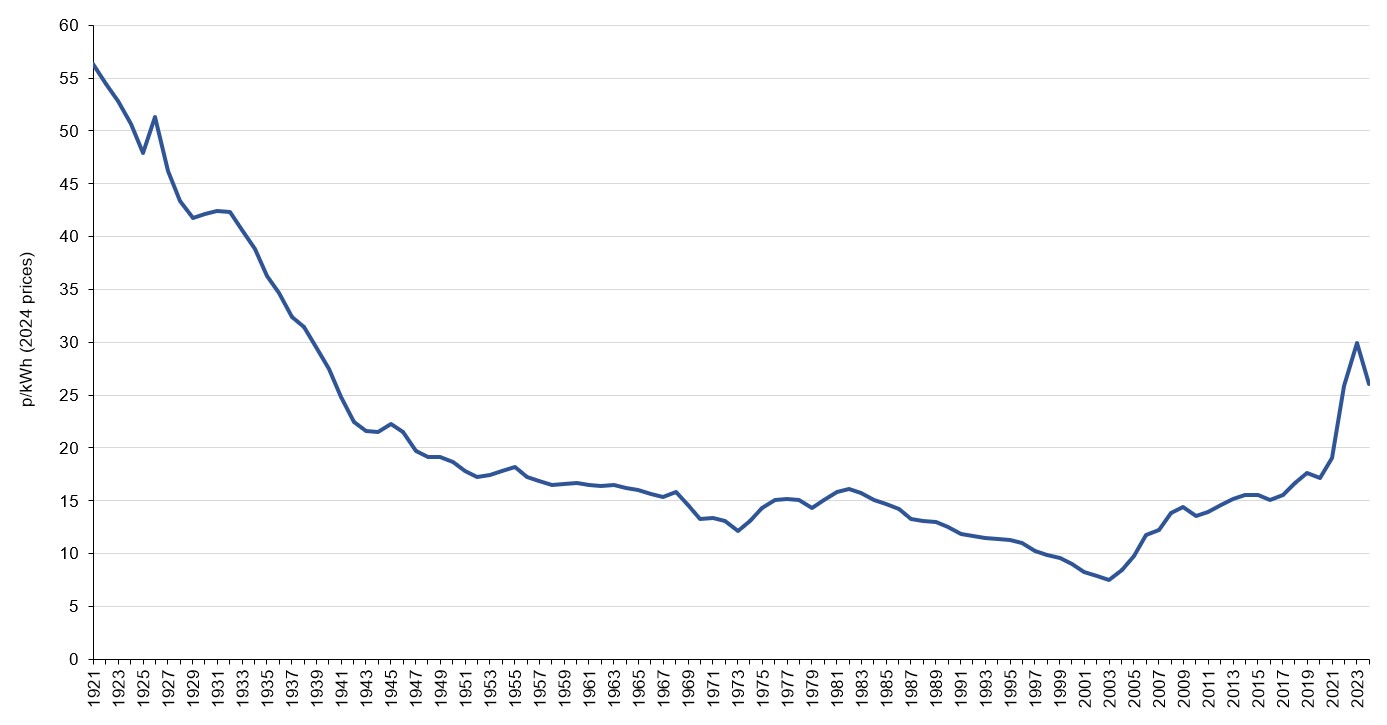
The rise in prices experienced since 2003 is unprecedented in magnitude and duration. The only previous period of sustained electricity price inflation, between 1973 and 1982, was much smaller and shorter. The recent inflation amounts to an extraordinary reversal of progress: the country has reverted to Second World War era prices.
Understanding the reasons for this deterioration is essential.
A favoured explanation frequently encountered in public discourse is that the price of electricity follows the price of those fossil fuels that are used to generate it, and that the prices of those fuels has risen; gas especially. As compelling as it sounds, it is inaccurate and deliberately misleading.
The following chart shows average electricity prices between 1996 and 2024, along with prices of thermal coal and natural gas. All prices are shown in 2024 equivalent prices.
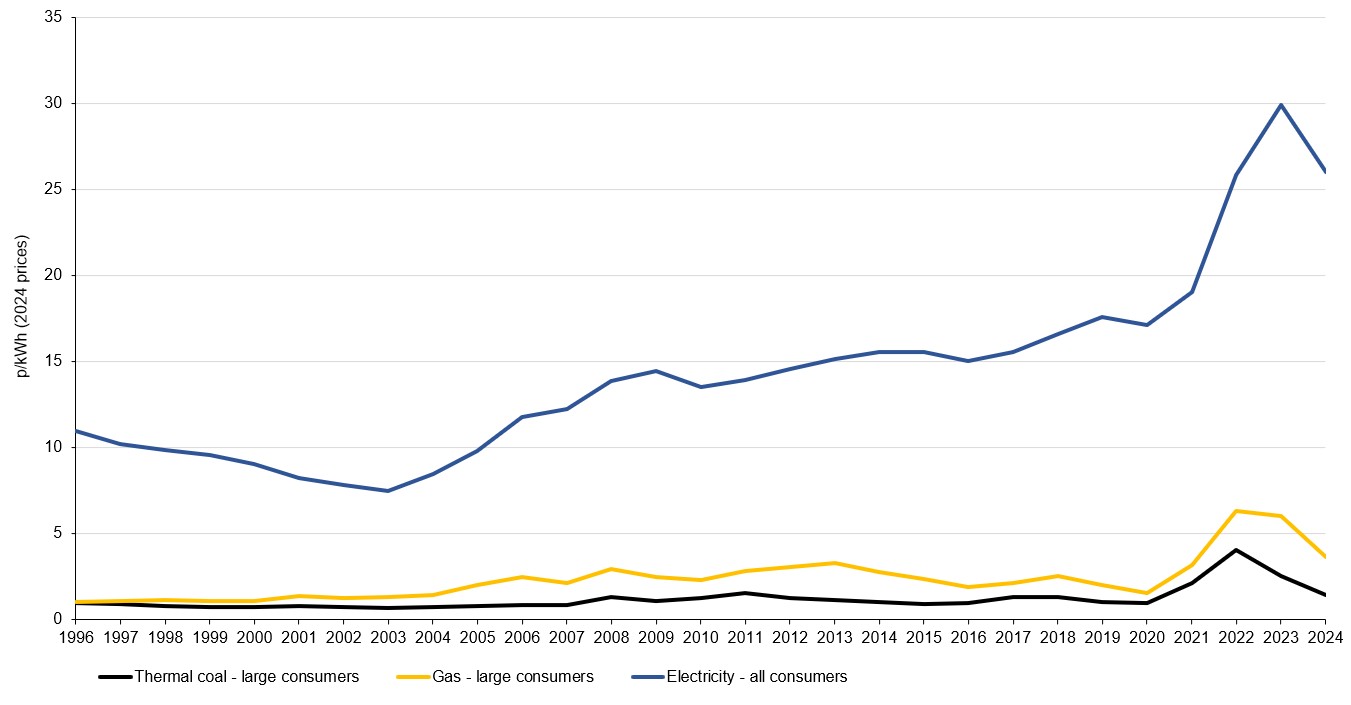
The prices of thermal coal and natural gas have both risen since 2003, but the magnitude of those increases is far smaller than the corresponding increase in electricity prices. Thermal coal increased by 0.73p, and natural gas by 2.33p. Electricity prices rose by 18.57p.
Allowance must be made for the fact that power stations require more than one unit of fuel to generate one unit of electricity. For a coal-fired plant operating at 35 per cent efficiency, an increase of 0.73p in the price of coal corresponds to a rise of 2.09p in the station’s fuel cost. For a gas-fired plant operating at 49 per cent efficiency, an increase of 2.33p in the price of gas corresponds to a rise of 4.76p in its fuel cost. These efficiency ratings are conservative; modern plants are substantially more efficient, and hence cheaper.
It is clear that higher fossil fuel prices cannot fully account for the rise in electricity prices experienced since 2003. If we take at face value the proposition that the price of gas is a decisive element, gas costs could be said to be responsible, at most, for a little over 25 per cent of the increase; 4.76p out of 18.57p.
But what of the other 75 per cent?
The following chart shows the amount of electricity supplied by the major categories of generators between 1998 and 2024, together with net imports via interconnectors. It also shows the total amount of electricity supplied and consumed.
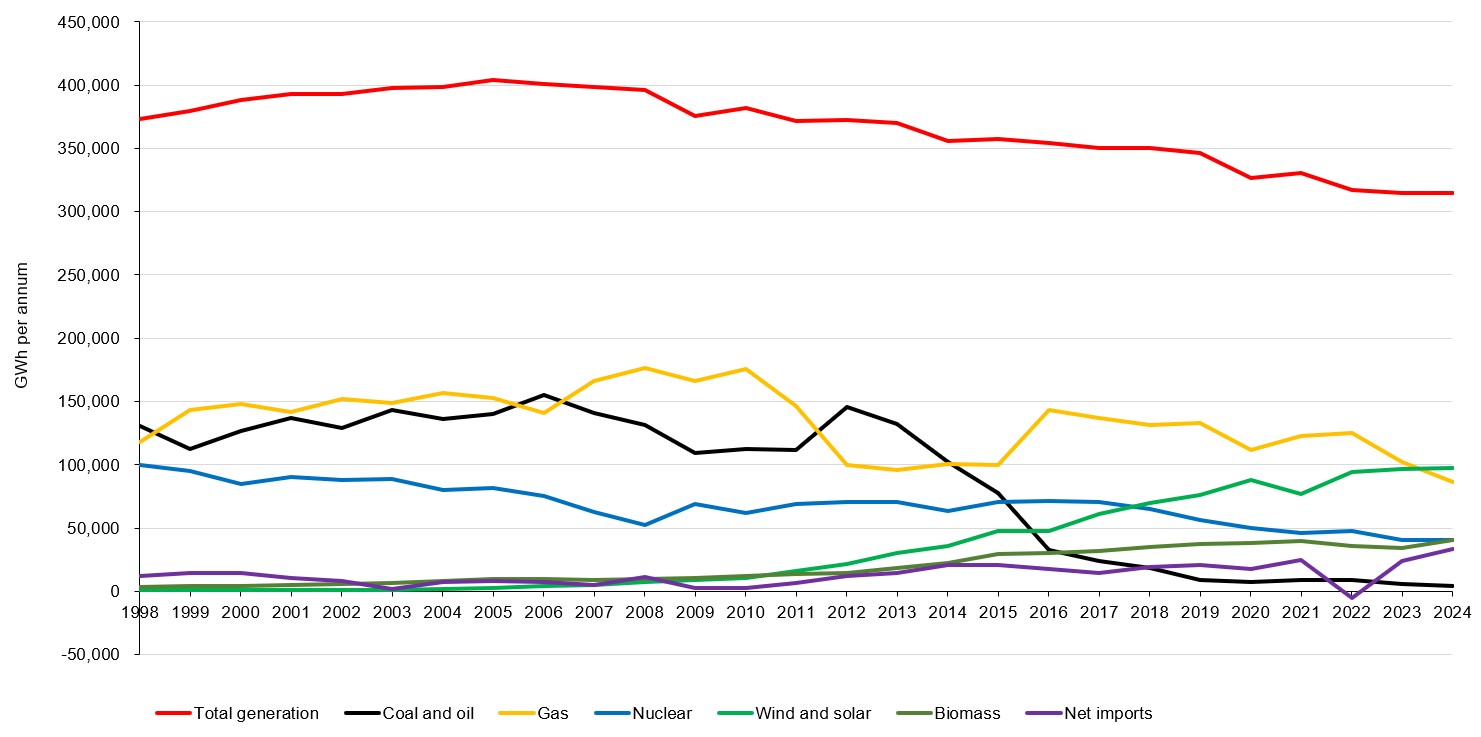
The composition of generation changed markedly between 2003 and 2024. Coal power dwindled. Gas and nuclear generation declined by approximately 9.6 percentage points each. In sharp contrast, wind, solar and biomass generation have boomed. In 2003, they accounted for a combined two per cent of supply. In 2024 they accounted for 43.9 per cent.
Therein lies an obvious clue as to why electricity prices have risen so markedly.
The following chart shows the composition of an average household’s electricity bill as of April to June 2025.
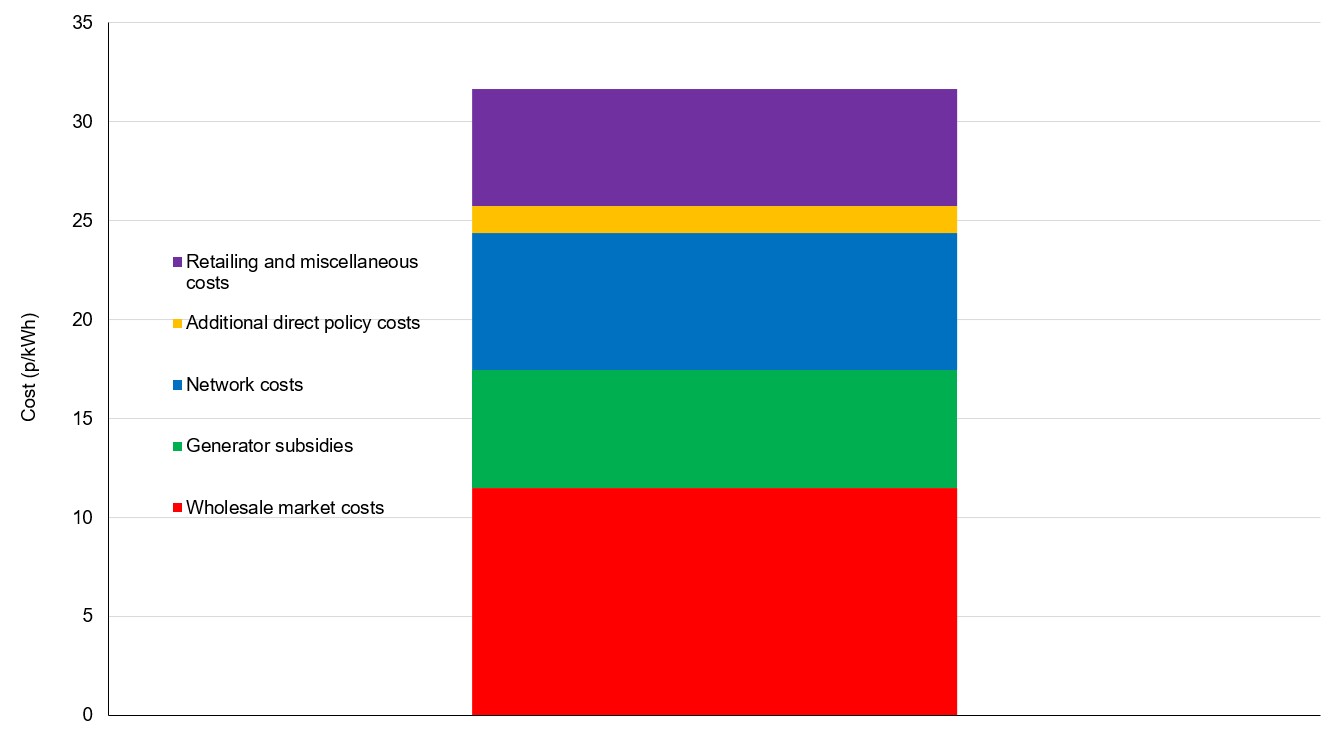
The basic cost structure shown in chart 5 also applies to the average business bill, although the exact amounts attributable to each category will differ.
The inflationary effect of policy can be seen explicitly in the presence of two categories: “generator subsidies” and “additional direct policy costs”.
The first category consists of subsidies paid to wind, solar and biomass plants, together with Capacity Market subsidies, which compensate for the impaired system reliability caused by wind and solar dependence. The second category consists mostly of the Warm Home Discount and the Energy Company Obligation. These are a mix of welfare benefits and energy consumption reduction measures. Additionally, most businesses pay the main rate of the Climate Change Levy tax.
However, the effect of policy extends beyond those two categories: it inflates the amounts attributable to “wholesale market costs” and “network costs”. Higher operating costs for generators are reflected in “wholesale market costs”. Greater grid infrastructure expenditure and higher system operation costs are reflected in “network costs”. The inflation of both categories reflects a large-scale reduction of electricity system efficiency, in the economic sense, as does the steady increase in electricity imports experienced since 2010.
The pursuit of lower greenhouse gas emissions has left us with electricity prices that are among the highest in the developed world, and far higher than in America and China. However, we are not obliged to suffer this self-inflicted harm indefinitely.
Policy can be changed, and markets can be reformed; but any pretence that this can be done in a manner similar to that of the last twenty years must be discarded. Similarly, we should not pretend that it can be done without breaking some furniture.
The Conservative Party is beginning to understand this; and so is the public.


![Donald Trump Slams Chicago Leaders After Train Attack Leaves Woman Critically Burned [WATCH]](https://www.right2024.com/wp-content/uploads/2025/11/Trump-Torches-Powell-at-Investment-Forum-Presses-Scott-Bessent-to-350x250.jpg)