
Deri Hughes is a private investor and former parliamentary assistant.
It would presumably not be a surprise for readers of this site to be told that conditions in the British housing market are less than optimal.
Admittedly, the definition of what is and is not optimal does rather depend on an individual’s preferences. However, I speak of housing as an essential commodity; the provision of shelter and a place of abode for individuals and their wider households. As with any commodity, supply and demand are critical.
First, the supply. The stock of housing is not static and eternal. Some is taken away by demolition, but most of it persists, and is added to by construction. The latter is essential, if any increase in the requirement for housing is to be satisfied.
The following chart shows the number of dwellings constructed in England and Wales in every year since 1900 (limitations on data mean that Scotland and Northern Ireland have been excluded).
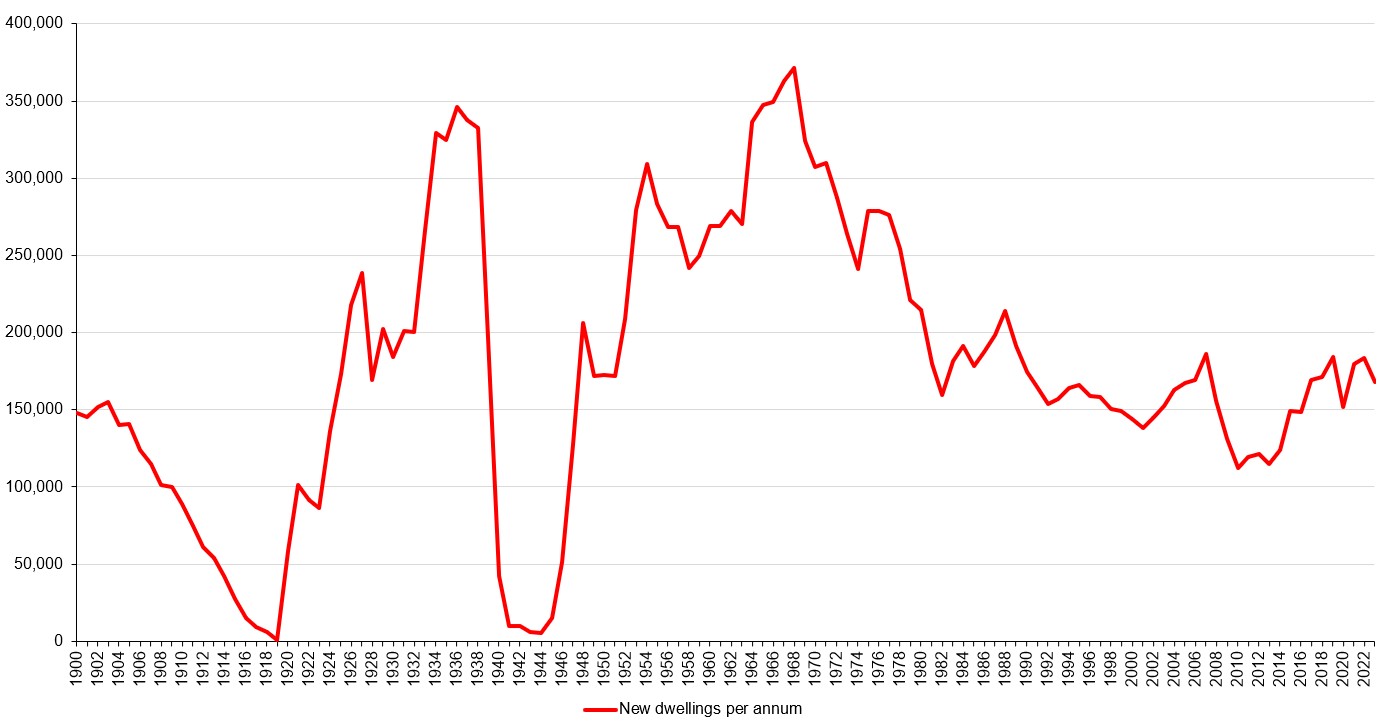
Chart 1 – housing construction in England and Wales, 1900-2023
The decline seen on the left side of the chart covers a period of economic weakness early in the 20th Century, as well as the First World War, which brought construction to an effective halt. It marked the end of a long and fruitful period of housing construction and wider development spanning the 18th and 19th centuries; one that created modern Britain and the modern world.
The pronounced spike between 1920 and 1939 corresponds with the inter-war housing construction boom. It is little appreciated these days, but its physical legacy can be seen clearly in and around major towns and cities. London’s surface area expanded significantly during those years, propelled by low density housing construction on the outskirts (where Tories can still be found). Housing of a similar style can readily be identified elsewhere.
The Second World War brought construction to a near halt. Afterwards, activity resumed quite briskly, ultimately peaking in 1968. Thereafter, it declined fairly steadily, reaching its nadir between 2010 and 2013. Since then, a modest recovery has been experienced, albeit leaving construction at levels approximately half those of the 1930s and 1960s peaks.
Now, the demand. There are several components and measures of demand for housing, but population growth is the most elementary and foundational. The following chart repeats the plot shown in chart 1, but adds a plot showing annual population growth in England and Wales over the same period.
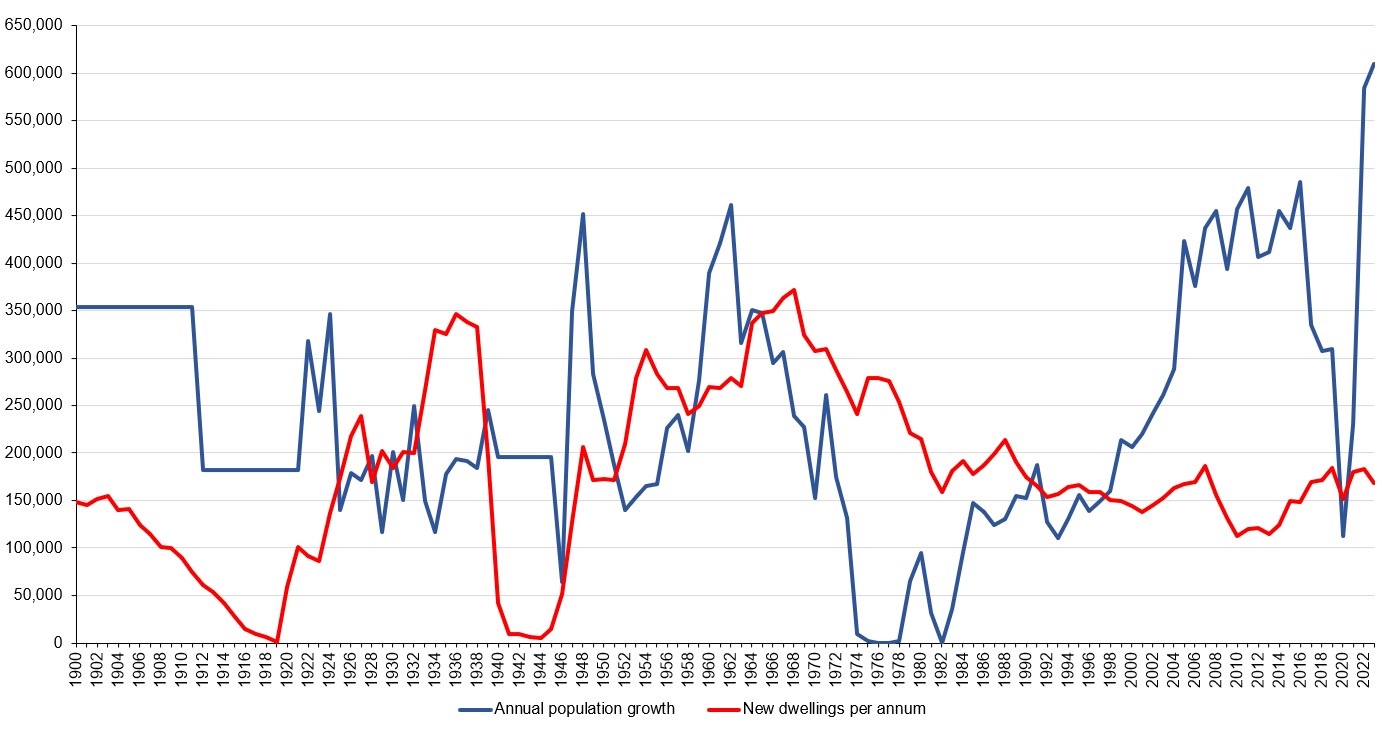
Chart 2 – housing construction and population growth in England and Wales, 1900-2023
The chart shows the temporal variation in housing construction in a different light. Prior to 1925, there was a notable deficit in construction, at least by the standards of most of the 20th Century. Thereafter, with the exception of the Second World War years, construction followed population growth quite well into the late 1960s.
Construction then declined, but declining population growth into the early 1980s created an effective surplus. A rough equilibrium was established between the mid-1980s and the mid-1990s. However, the position then changed rather dramatically.
“Things can only get better”, someone claimed in or around 1997. That claim was patent nonsense in several respects; and certainly with regard to the housing market. Since the late 1990s, the country has experienced a combination of strong immigration-driven population growth and weak housing construction. It is a potent mixture, with predictable consequences for the housing market.
It is both tempting and justifiable to condemn the New Labour administrations for this state of affairs. Equally, however, no attempt should be made to excuse the Conservatives of the 2010-2024 governmental vintage. Their performance was dire, with 2022-2024 standing out as their epic Wagnerian climax – or “the crowning turd in the waterpipe”, pace General Melchett. A future government that is minded to improve matters would be contending as much with a Conservative legacy as with a Labour one.
Immigration policy has obvious implications for the housing market, with particular reference to the demand for housing. However, immigration is a topic unto itself, and is receiving ample attention as it is. The supply of housing is a less prominent subject, but merits attention.
The following chart shows total housing construction in England and Wales between 1920 and 2023, along with two additional plots showing the numbers attributable to private sector and public sector commissioning.
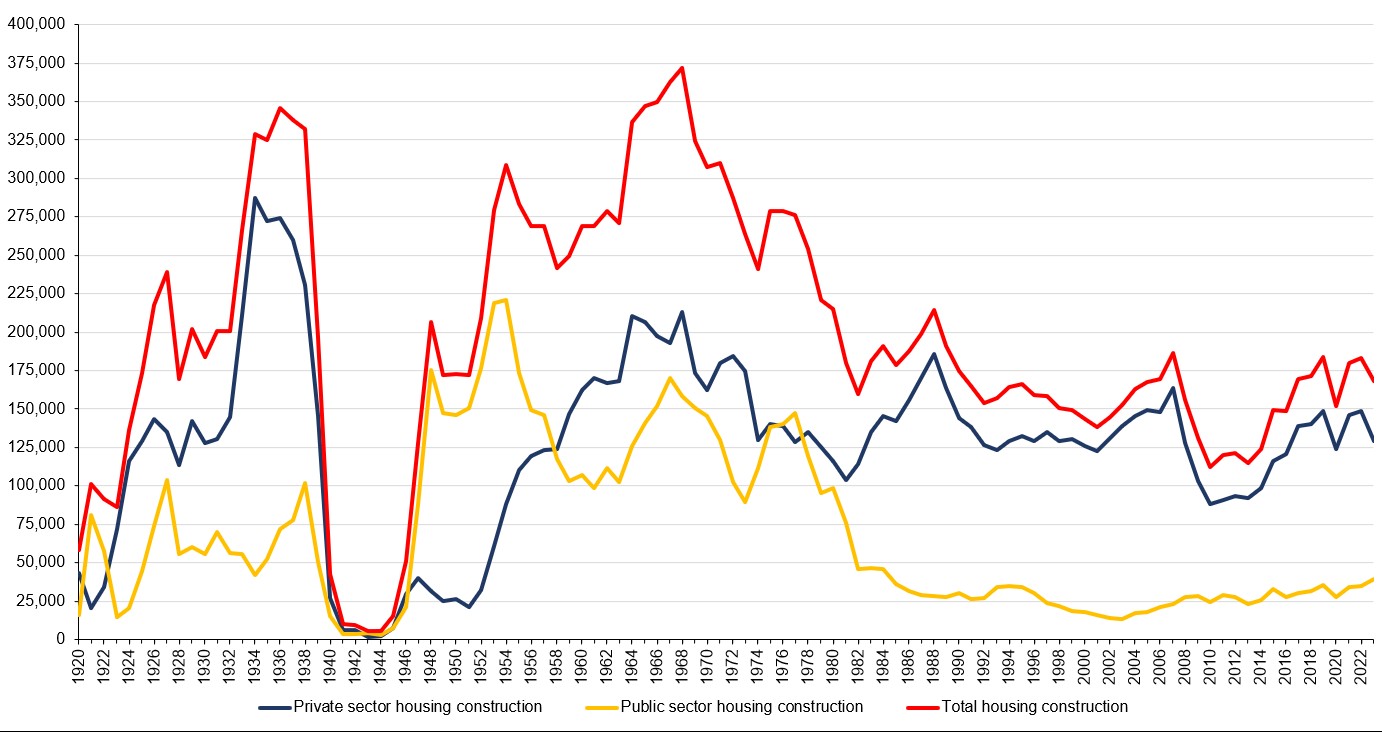
Chart 3 – private sector, public sector and total housing development in England and Wales, 1920-2023
The inter-war years and the 1948-1980 period both stand out for high total construction activity, but with very different commissioning proportions. The 1948-1980 period is well known for its state-sponsored housing development, whereas the inter-war period ought to be recognised for the productivity of private developers during that time.
Another important difference between the two periods is that they are divided by law. The Town and Country Planning Act 1947 created the modern planning system. It established the principle that land owners are not free to develop their land as they see fit; the state must approve any such activity. The full extent of planning law has expanded greatly in detail since 1947, but that basic principle persists.
The post-1948 experience demonstrates that the existence of planning control is not, in and of itself, a barrier to large-scale housing development.
However, it has left development activity at the mercy of the political class and their fashions. If the latter are supportive of development, it can proceed. If they are hostile, it cannot.
Their influence also extends to the nature of development. If they support low density housing, low density housing will be built. If they prefer tall buildings in the style of Soviet kitsch, the latter will (and did) appear like mushrooms. More recently, whether by design or by default, policy has again favoured housing the teeming urban masses in tall buildings, but with asbestos and brutalist concrete having been displaced in notoriety by flammable cladding. (Yes, it’s dangerous, but it complied with insulation performance standards; think of the climate!)
The simple truth is that the political class has become far more hostile to housing development in recent decades; and especially hostile to low density housing, which is the type that most of the public prefers. Some of the hostility is manifested in campaigning, and in decisions by planning officials.
Much, however, stems from the detail of legislation. Either way, if voles, a view of a field, and the tyrannical pagan deity known as “the environment” are to be ranked above the housing of lesser creatures, the latter will not be housed.
Such is the essence of the current planning system. It has the air of indulgence, complacency, and chronic stagnation. However, all of that can be changed: it is a matter of mindset and text on pages, not some titanic struggle with the laws of physics. It is also quite an opportunity, in more ways than one.
![Scott Bessent Explains The Big Picture Everyone is Missing During the Shutdown [WATCH]](https://www.right2024.com/wp-content/uploads/2025/11/Scott-Bessent-Explains-The-Big-Picture-Everyone-is-Missing-During-350x250.jpg)


![Milwaukee Brewers’ Karen Fired After Confrontation with LA Dodgers Fan Goes Viral [WATCH]](https://www.right2024.com/wp-content/uploads/2025/10/Milwaukee-Brewers-Karen-Fired-After-Confrontation-with-LA-Dodgers-Fan-350x250.jpg)