Lord Ashcroft KCMG PC is an international businessman, philanthropist, author and pollster. For more information on his work, visit lordashcroft.com
My latest poll asks what people think of Reform’s plans on illegal migration, what they think is coming in the November Budget, whether rules matter more than results, whether Labour and Conservative defectors are coming back, what they think about the flags, and how free they feel to express an opinion on controversial issues. We also looked at hypothetical voting intention if Reform and the Tories were to form an alliance.
What have people noticed? And who has noticed what?
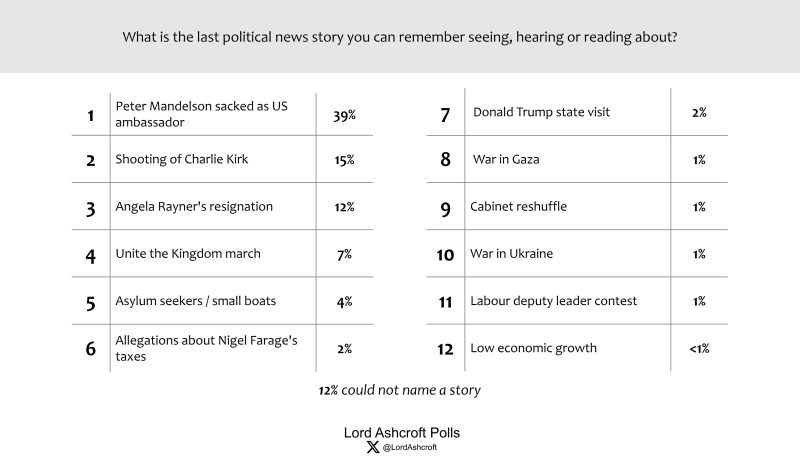 The resignations of Peter Mandelson and Angela Rayner dominated respondents’ recollections of domestic political news, followed by Tommy Robinson’s Unite the Kingdom march in London. The shooting of Charlie Kirk was the second most recalled story.
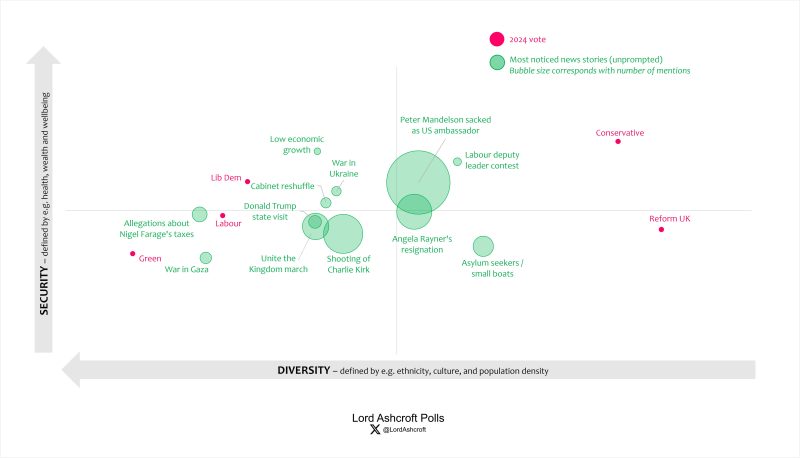
Our political map shows what kind of voters were most likely to recall which news. The two resignations appear close to the centre of the map, showing that recall of those stories was fairly even throughout the electorate. Notably, stories about Charlie Kirk, President Trump’s state visit and the Unite the Kingdom march were most likely to be mentioned in more left-leaning territory.
What have Labour done so far?
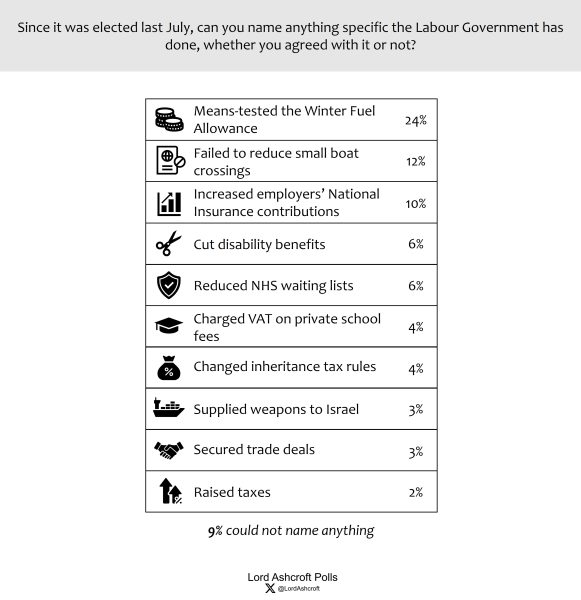
Means testing winter fuel payments continues to top the list when we ask what specific things the Labour government has done so far – indeed the top four (winter fuel, failing to stop small boats, raising employers’ National Insurance and attempting to cut disability benefits) are unchanged since last month. However, the proportion who mentioned cutting NHS waiting lists has doubled to 6 per cent.
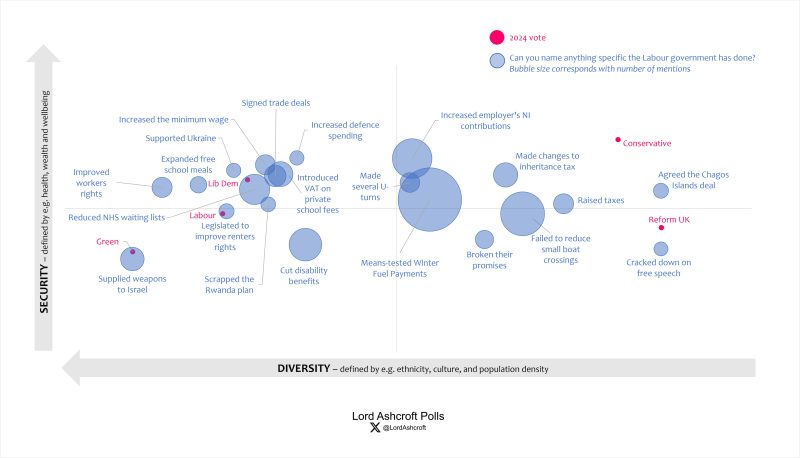
Our political map shows that small boats, free speech and tax were most likely to be mentioned in Conservative and Reform-supporting parts of the map, while support for Israel was most often mentioned in Green territory in the bottom-left quadrant. Positive actions were heavily clustered around the centre of gravity of Labour and Lib Dem support.
Flags and free speech
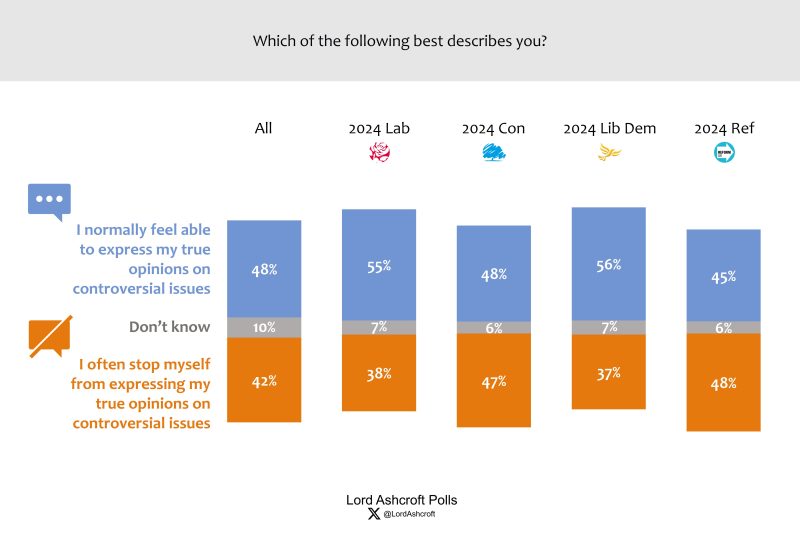
Just under half of all voters said they normally feel able to express their true opinions on controversial issues, while 42 per cent said they often stopped themselves from doing so. Those currently intending to vote Conservative and Reform were more likely to say they often stopped themselves than that they usually felt free to express their views. The youngest voters (18-24) were the most likely to say they usually felt able to express themselves, while those aged 50-64 were more likely than not to say they often stopped themselves.
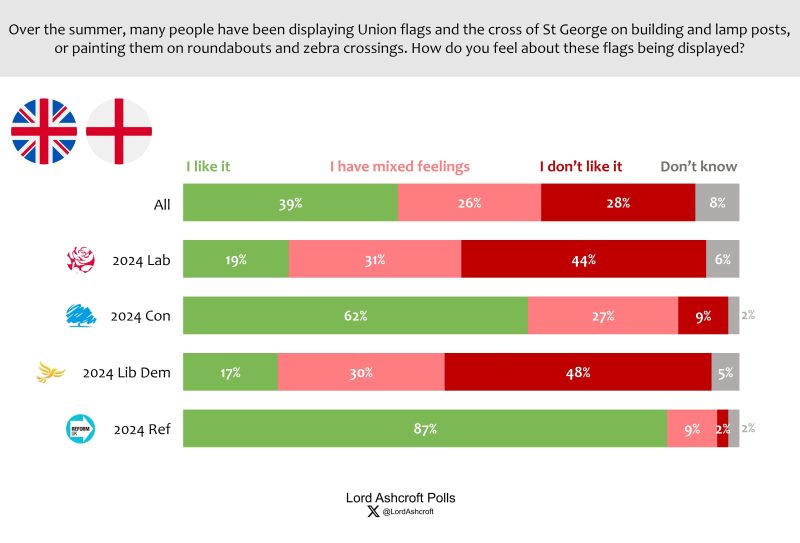 Overall, 39 per cent said they liked the flags being displayed, while 28 per cent said they didn’t like it and a further quarter said they had mixed feelings. While majorities of 2024 Conservatives and Reform UK voters said they liked the spectacle, pluralities of Labour (and Lib Dem voters said they didn’t like it, as did a majority of 2024 Green voters. Support for the flags rose by age group: fewer than half of 18-24 year-olds said they liked seeing them, compared to more than half of those aged 65 or over.
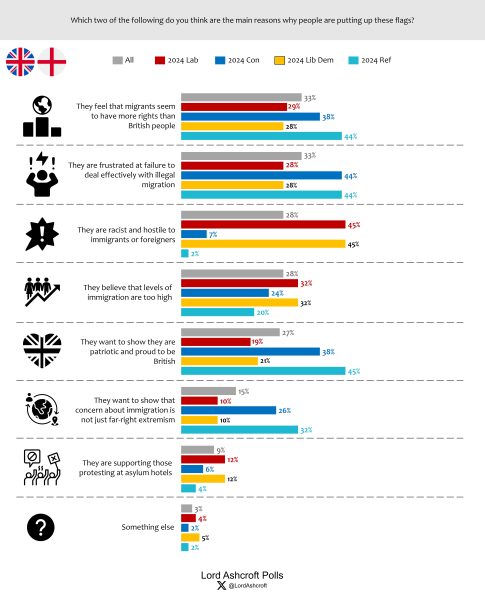
When we asked people to choose the main reasons why people had been putting up flags, the most common choices were “they feel that migrants seem to have more rights than British people” and “they are frustrated at failure to deal effectively with illegal migration”. However, among those currently intending to vote Labour, Lib Dem or Green, the most common explanation was “they are racist and hostile to immigrants or foreigners”.
Reform UK and illegal migration
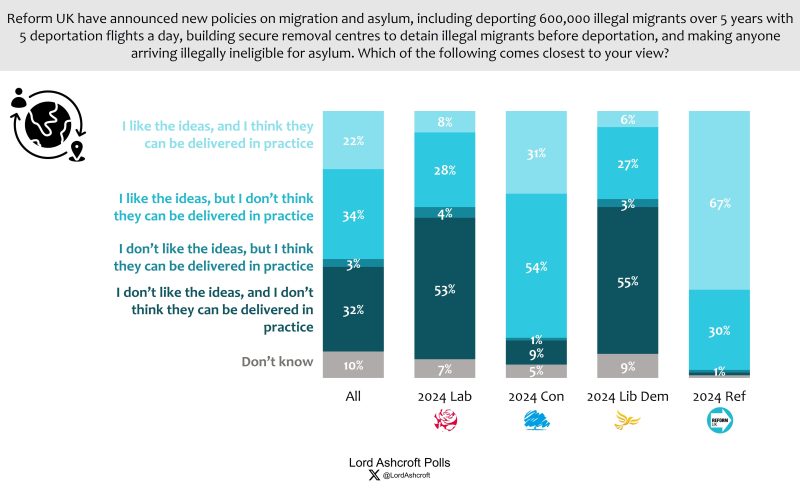 A majority overall said they liked the ideas, but only just over a fifth also said they thought they could be delivered in practice. Two thirds of Reform UK voters said they both liked the ideas and thought they could be delivered. Of those who said they liked Reform’s ideas on dealing with illegal migration but didn’t think they could be delivered in practice, more than seven in ten said they should be tried anyway because any progress would be good. Just under one fifth said they should not try to implement them as it could prove an expensive failure.
Process v. outcome
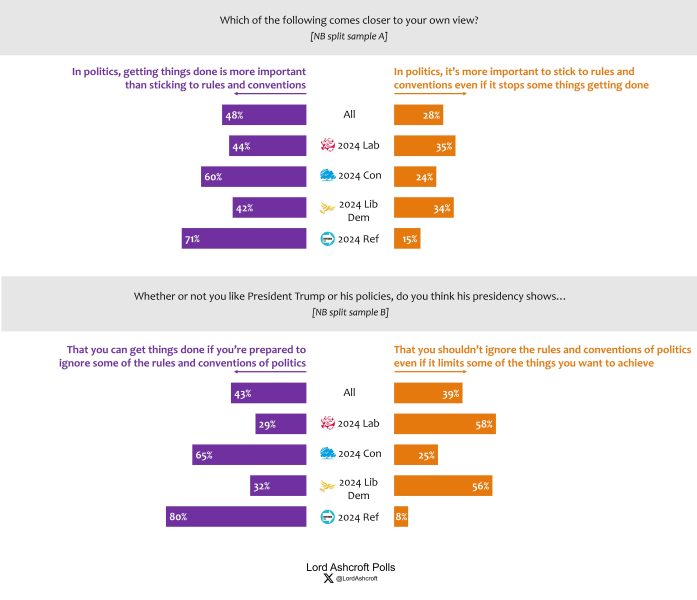
Just under half agreed that in politics, getting things done was more important than sticking to rules and conventions, while 28 per cent thought it was more important to stick to such rules and conventions even if it stops some things getting done. Clear majorities of 2024 Conservatives and Reform UK voters agreed that getting things done was more important, while Labour and Lib Dem voters agreed by smaller margins.
However, voters were more circumspect when President Trump was named. 43 per cent said his presidency showed you can get things done if you ignore some of the rules and conventions of politics, while 39 per cent (11 points more than in the previous question) said it showed that you shouldn’t ignore the rules and conventions of politics even if it limits some of the things you want to achieve.
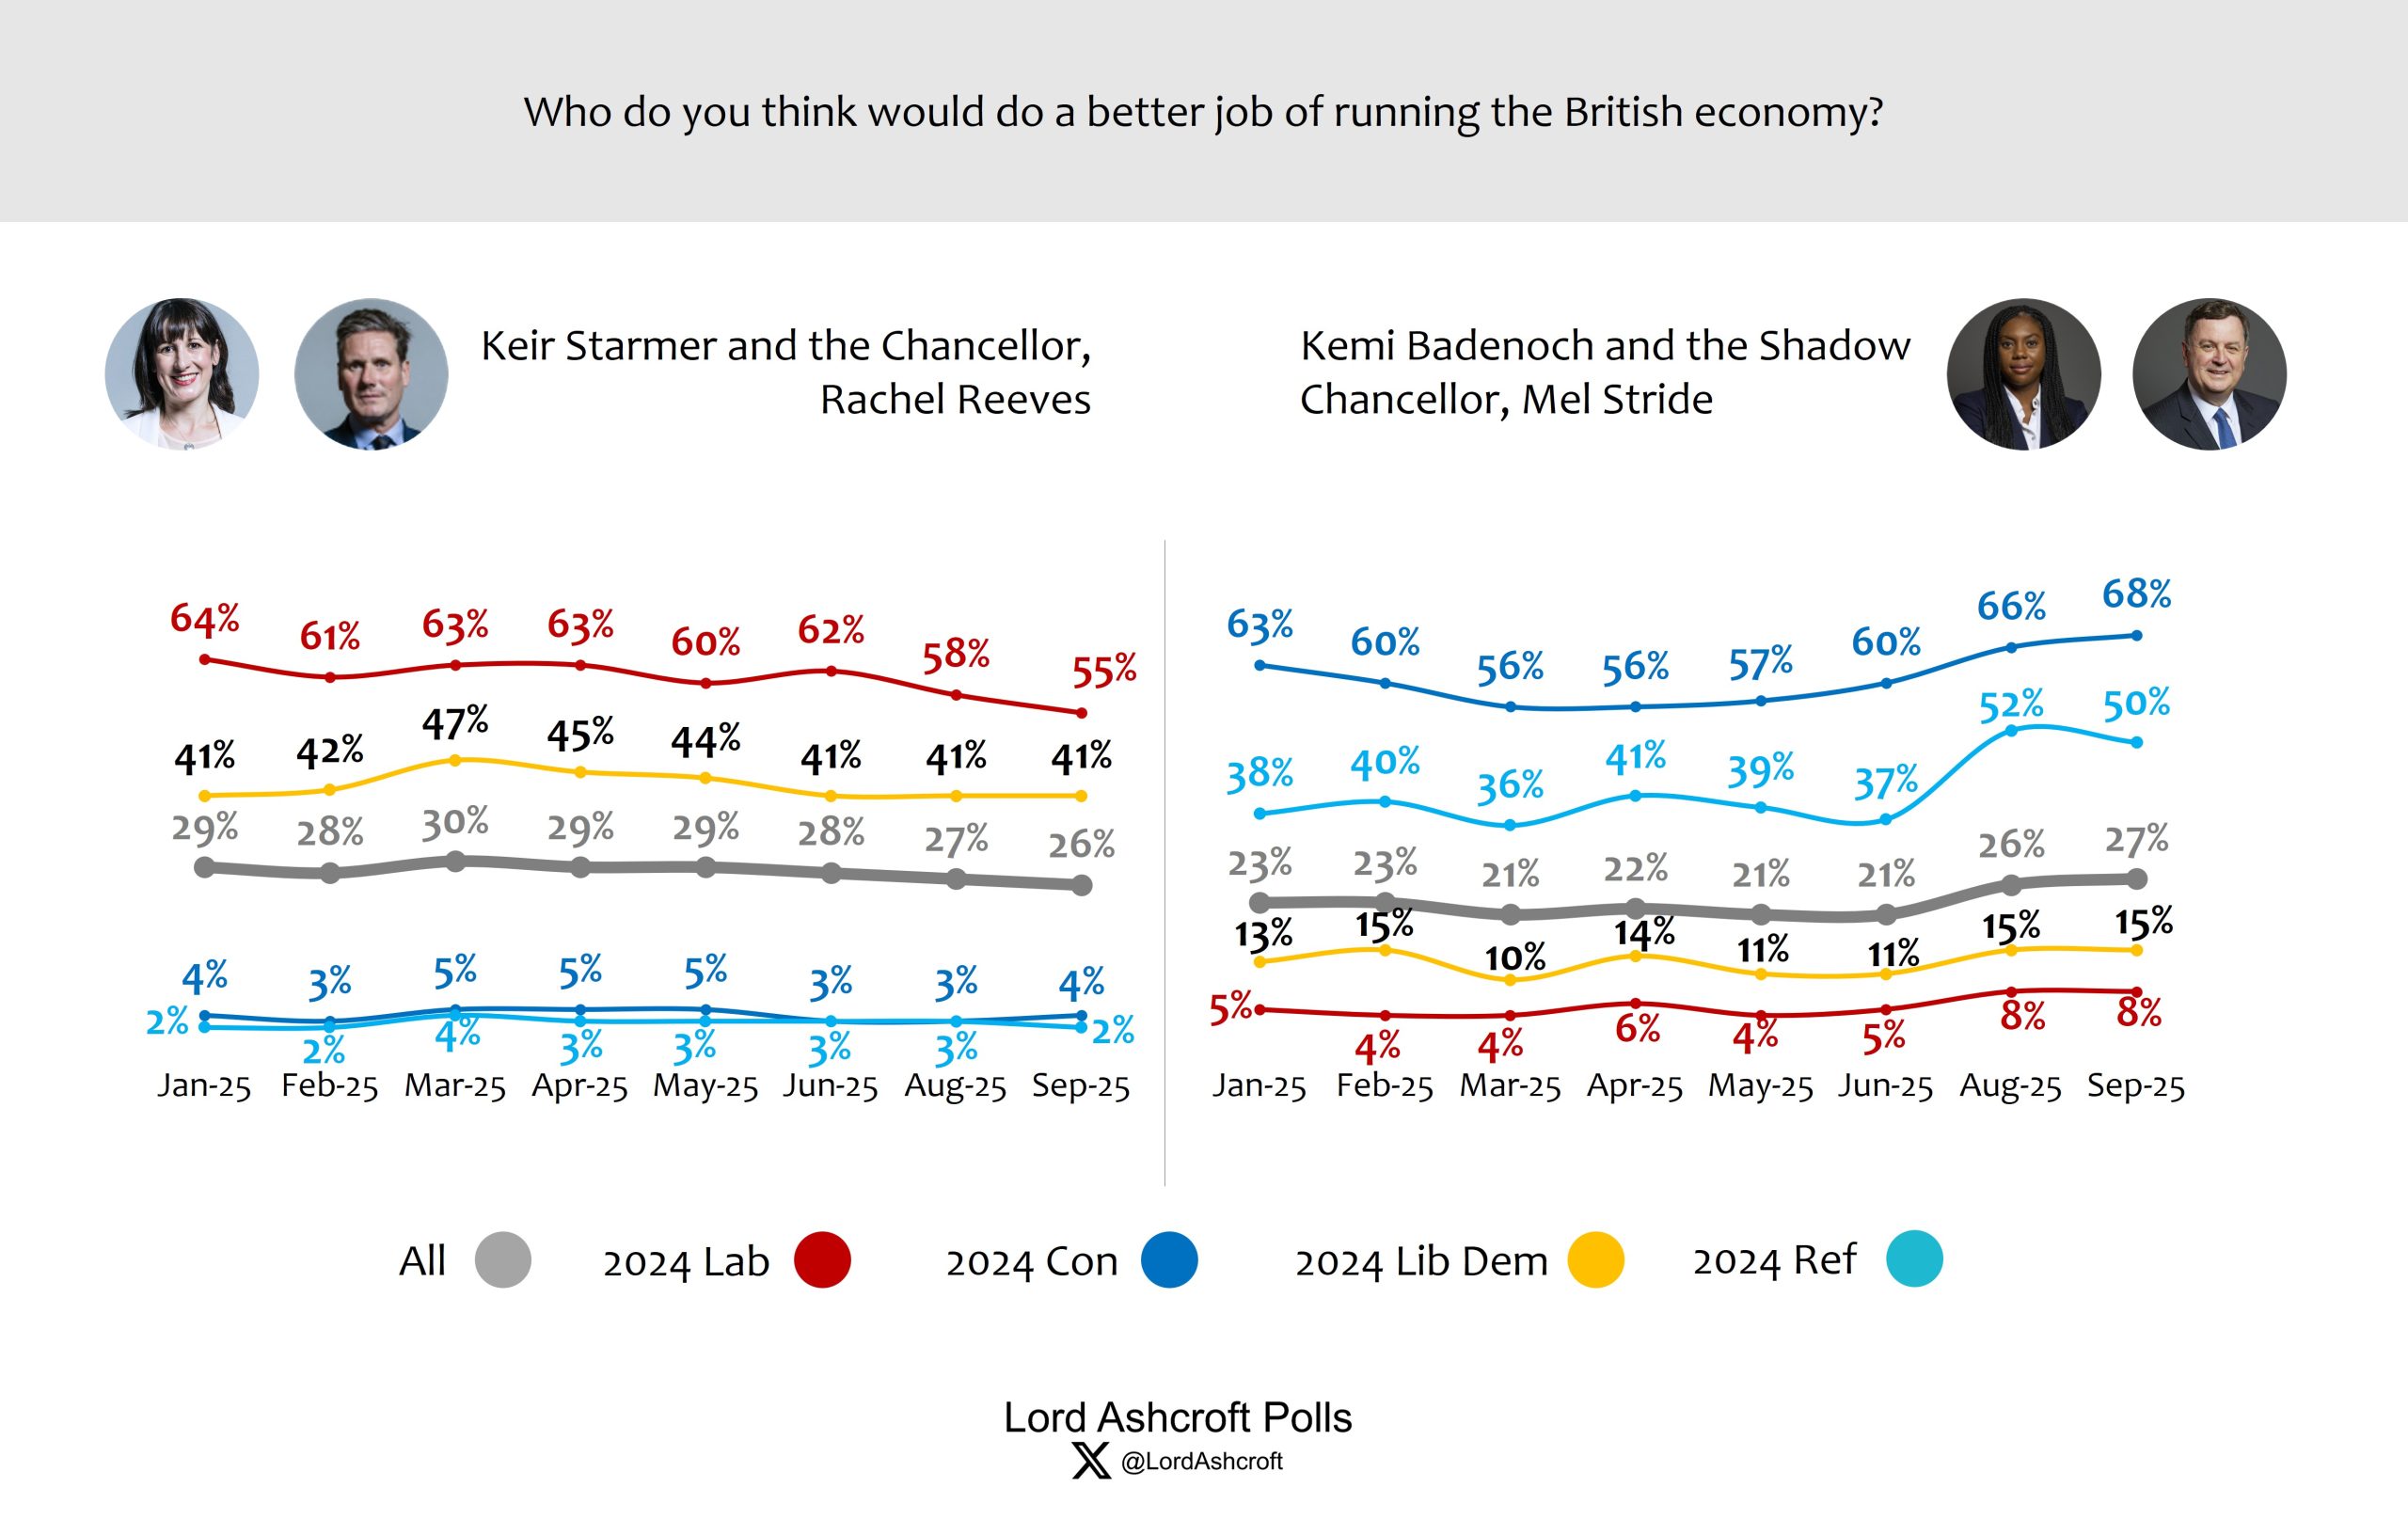
The economy and the Budget
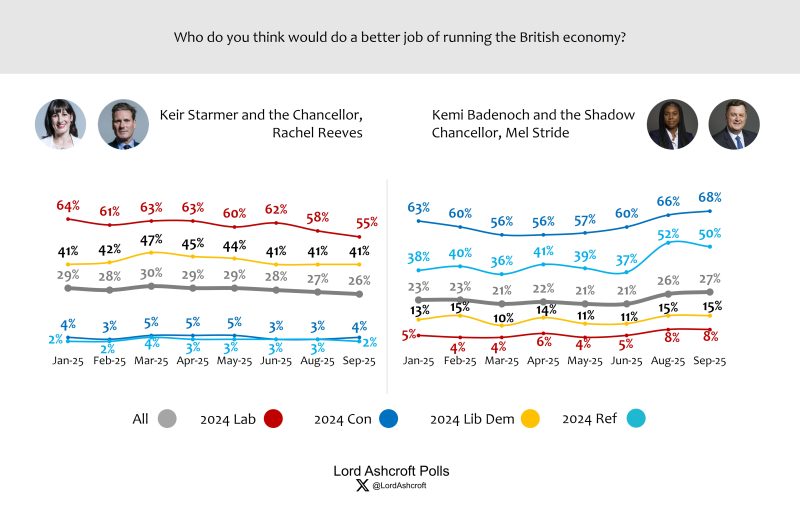
Asked who would do the better job running the economy, voters chose Kemi Badenoch and Mel Stride over Keir Starmer and Rachel Reeves by 27 per cent to 26 per cent, with just under half saying “don’t know” – the first Conservative lead on the issue since before the election. Only 55 per cent of 2024 Labour voters named the Labour team; more than two thirds of 2024 Conservatives chose the Tory team.
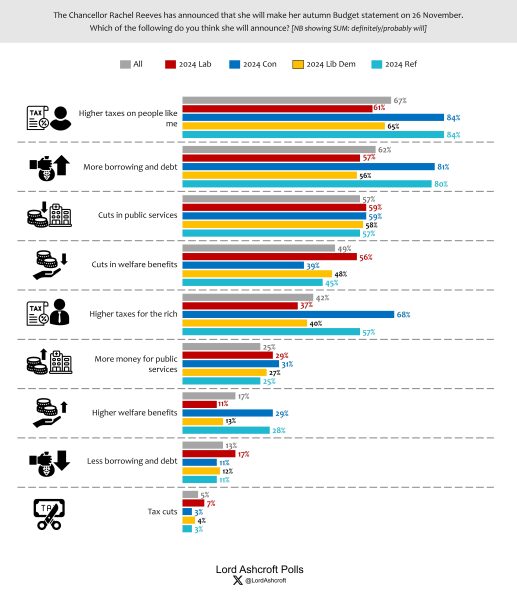
We asked whether people thought a range of things would or would not be announced in the November Budget. Top of the list, each expected by a majority of voters, were “higher taxes on people like me” (expected by more than two thirds, including 61 per cent of 2024 Labour voters), “more borrowing and debt” and “cuts in public services”. People were more likely to expect higher taxes on them personally than on “the rich”. Just under half anticipated cuts in welfare benefits. Only a quarter expected “more money for public services”.
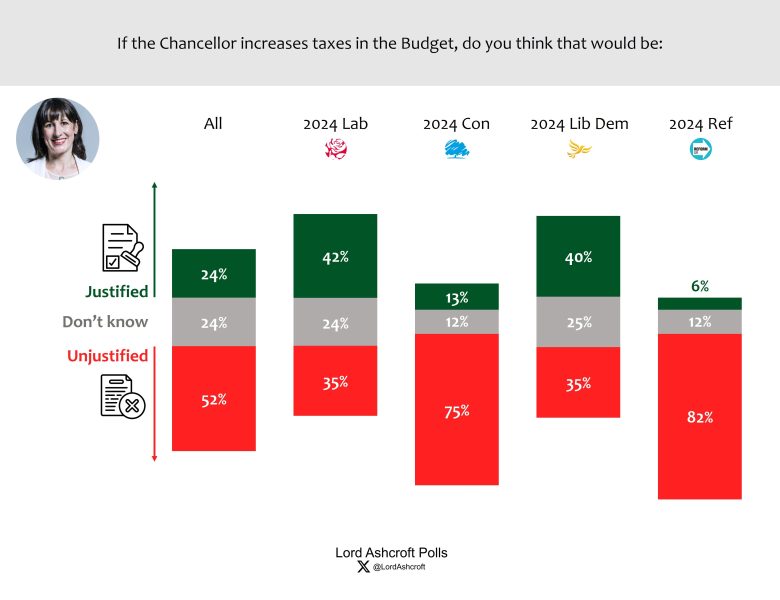 A majority of all voters, including more than one third of 2024 Labour and Lib Dem voters, said they thought tax increases in the November Budget would be unjustified. Those who switched from the Conservatives to Labour in 2024 said they would be unjustified by a 17-point margin.
Labour and Conservative defectors
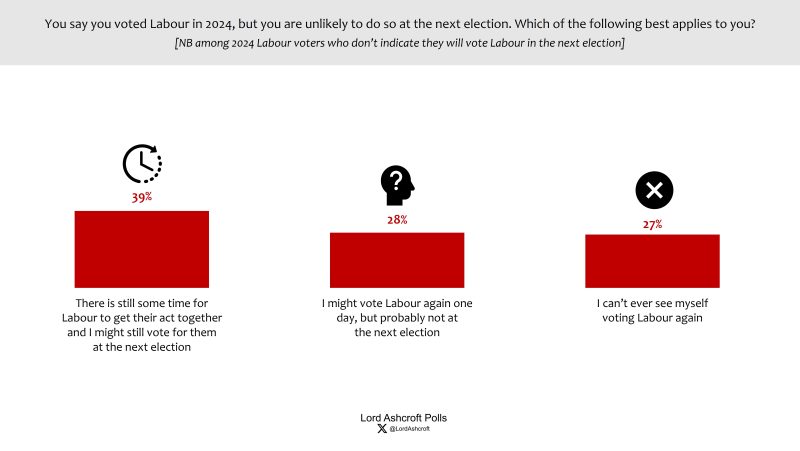
Among 2024 Labour voters who do not currently say they will vote for the party at the next election, just under four in ten say there is still time for the party for their act together and they might still return next time. The remainder were evenly divided between saying they might vote Labour again one day but probably not at the next election and that they can’t ever see themselves voting Labour again.
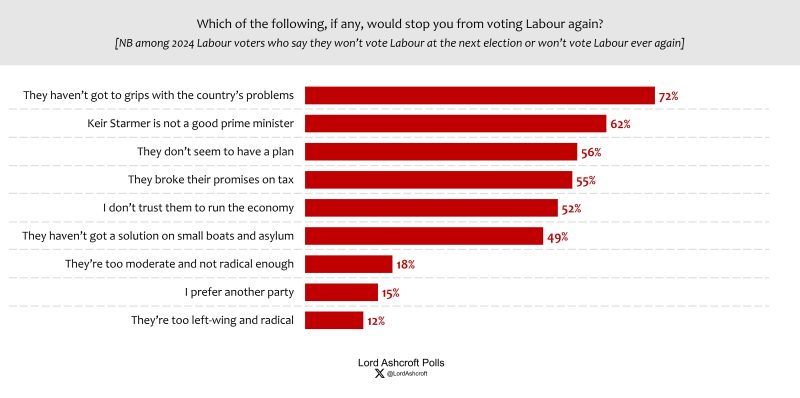
For 2024 Labour voters who do not intend to vote Labour at the next election, the single biggest reason was “they haven’t got to grips with the country’s problems”, chosen by 72 per cent. “Keir Starmer is not a good prime minister” was second, while majorities also said “they don’t seem to have a plan”, “they broke their promises on tax” and “I don’t trust them to run the economy”.
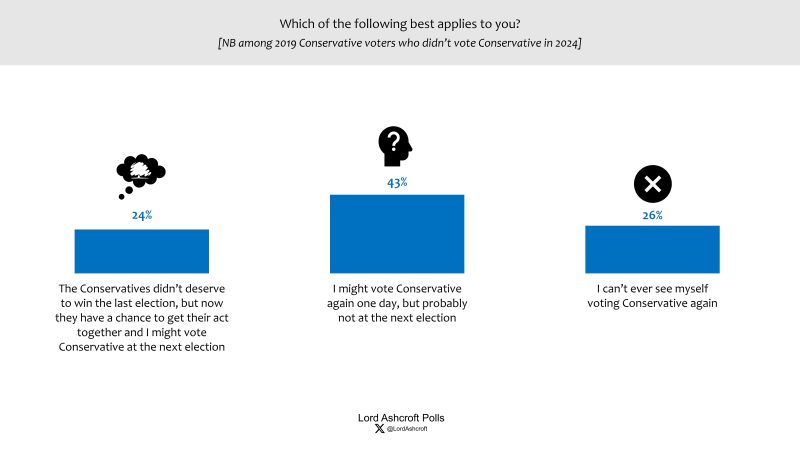
Among those who voted Conservative in 2019 but not in 2024, just under a quarter said the party had a chance to get its act together and they might return at the next election. Those who switched to the Lib Dems in 2024 were significantly more likely to say this (40 per cent) than those who switched to Labour (24 prr cent) or to Reform UK (19 per cent). The remainder were more likely to say they might vote Tory again but probably not at the next election than that they could never see themselves voting Conservative again.
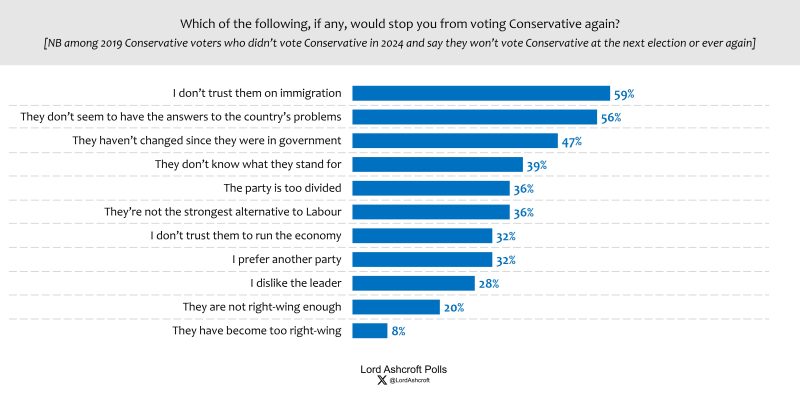
Among those who switched away from the Conservatives in 2024 and say they probably won’t return at the next election, the main reasons were “I don’t trust them on immigration”, “they don’t seem to have the answers to the country’s problems” and “they haven’t changed since they were in government”.
Best PM and the next election
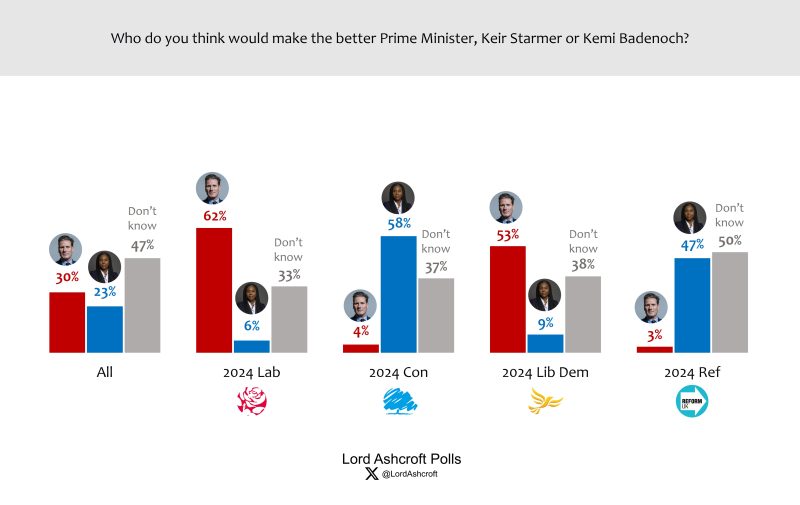 Given a choice between Keir Starmer and Kemi Badenoch, voters overall say Starmer would make the better PM by a 7-point margin, though with nearly half saying “don’t know”. Those who voted Reform UK in 2024 said they preferred Badenoch to Starmer by a 44-point margin, but with half saying “don’t know”.
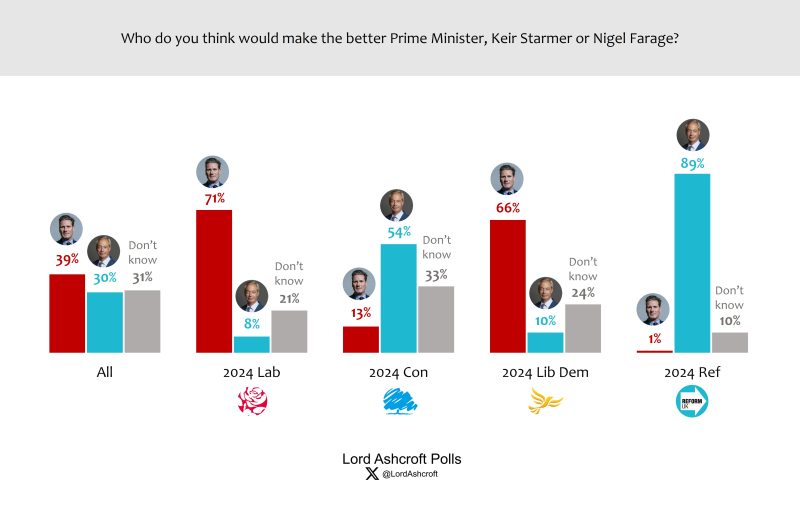 Given a choice between Starmer and Farage, voters as a whole chose Starmer by a 9-point margin, with 31 per cent saying “don’t know”. 2024 Conservatives chose Farage over Starmer by 54 per cent to 13 per cent, while 2024 Labour voters chose Starmer by 71 per cent to 8 per cent.
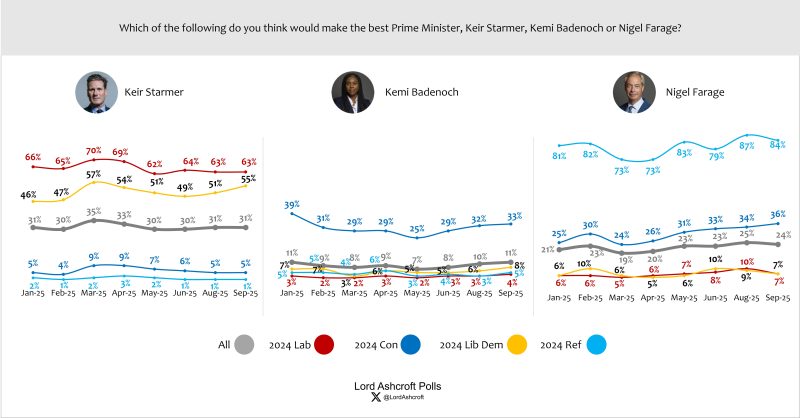
Offered a choice between Starmer, Badenoch and Farage, voters chose Starmer over Farage by a 7-point margin, with Badenoch in third place on 11 per cent.
We asked respondents how likely they were to vote for each party at the next election on a 100-point scale, where zero means there is no chance they would vote for that party and 100 meant they would definitely do so. Those who voted Labour in 2024 put their chances of doing so again at the next election at an average of 46/100, compared to 58/100 in March. Those who voted Conservative were more likely to repeat their 2024 vote (59/100, down from 68/100 in March). Those who voted Reform UK put their chances of doing so again at 73/100, up from 64/100 in March.
Those who switched to Labour in 2024 put their chances of voting for the party again next time at 36/100. Those who switched from the Conservatives to Labour in 2024 put their chances of voting Labour again next time at an average of 25/100 (and their chances of going back to the Tories at 23/100 and of going to Reform UK at 21/100). Those who switched away from the Conservatives in 2024 currently put their likelihood of returning to the Tories next time at 22/100. Those leaning towards Reform were the most intense supporters – they gave themselves a higher mean likelihood of doing so (91/100) than those leaning Conservative (86), Labour (81) or Lib Dem (82).
Looking at those more likely than not to vote for a particular party (those whose highest likelihood of voting for one party was at least 50/100), this implies current vote shares of Reform UK 27 per cent, Labour 22 per cent, Conservative 19 per cent, Green 13 per cent, Lib Dems 10 per cent, Others 9 per cent.
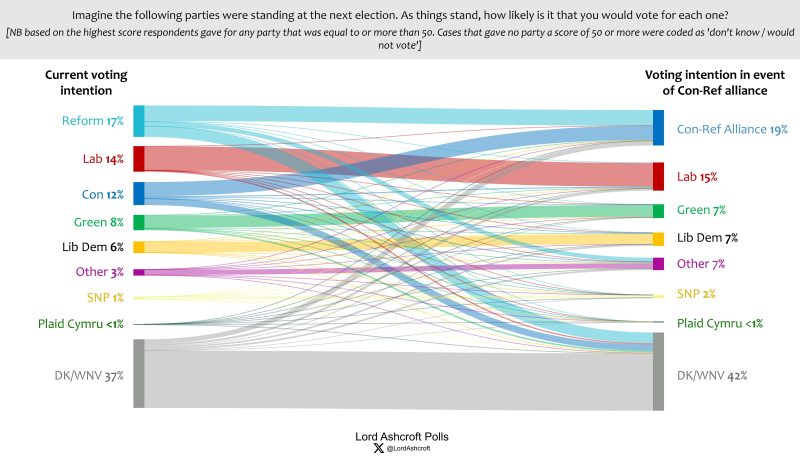
We asked the same voting intention question asking voters to imagine that Reform UK and the Conservatives had formed an alliance. Using the same methodology as above, this implied current vote shares of: Conservative/Reform Alliance 33 per cent, Labour 26 per cent, Lib Dems 12 per cent, Greens 12 per cent, Others 17 per cent.
It was notable that the Con-Reform share (33 per cent) was considerably lower than the parties’ combined vote share when they were listed separately (46 per cent). Only half of those who initially said they would vote Reform UK then said they would vote for a Conservative-Reform Alliance. More than one third said they didn’t know how they would vote and 13 per cent said they would vote for another smaller party (other than Labour, the Lib Dems or Greens).
 Only 61 per cent of those who initially said they would vote Conservative then said they would vote for a Conservative-Reform Alliance. More than a quarter said they didn’t know what they would do, and 8 per cent said they would switch either to Labour, the Lib Dems or the Greens.
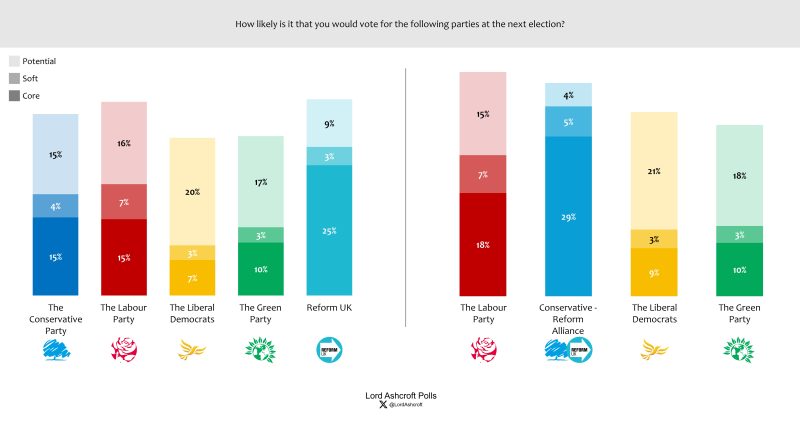
We can use people’s stated likelihood to vote for each party to estimate the floor and ceiling of support for Labour, the Conservatives, Reform, the Lib Dems, the Greens, and a theoretical Conservative-Reform Alliance. We do this by identifying three types of voters for each party: Core voters, Soft voters and Potential voters.
Core voters are those who currently intend to support the party at the next election and whose likelihood of support is very high (75+ out of 100). We display these at the bottom of the stacked bar, in the darkest shade. Soft voters also currently intend to support the party at the next election, but whose likelihood of doing so is between 50 and 75. These are in the middle of the stacked bar, in the medium shade. Potential voters are currently intending to support a different party, but are at least slightly open (25+ out of 100) to supporting this party. These are displayed in the top of the stacked bar in the palest shade.
The floor of a party’s vote is their core vote (first bar); their current support is the core vote plus soft vote (first two bars), and a party’s ceiling is all three bars combined.
We can see from this that Reform UK have a very high floor, at just under 25 per cent of the vote (Labour and the Tories both have a floor at around 15 per cent of the vote). However, the gap between the floor and ceiling for Reform is much narrower than for other parties. Labour’s vote even now is very soft, both in absolute and proportional terms. Reform’s core vote is currently 10 points larger than Labour’s core vote.
The Lib Dems have an extremely low core vote even compared with the Greens. Both have ceilings of around 30 per cent, which probably reflects a willingness among left-wing voters to support either as a tactical option.
A Conservative-Reform alliance would not do much better than Reform alone. However, we can see that such an alliance would harden the Labour vote and push Labour’s ceiling above the alliance’s. The Lib Dems would see their ceiling rise in response to such an alliance, though the Greens would not.
In other words, the comparatively small advantages of a Conservative-Reform Alliance in consolidating the right of centre vote may be outweighed by galvanising the anti-right forces in British politics.
The political map
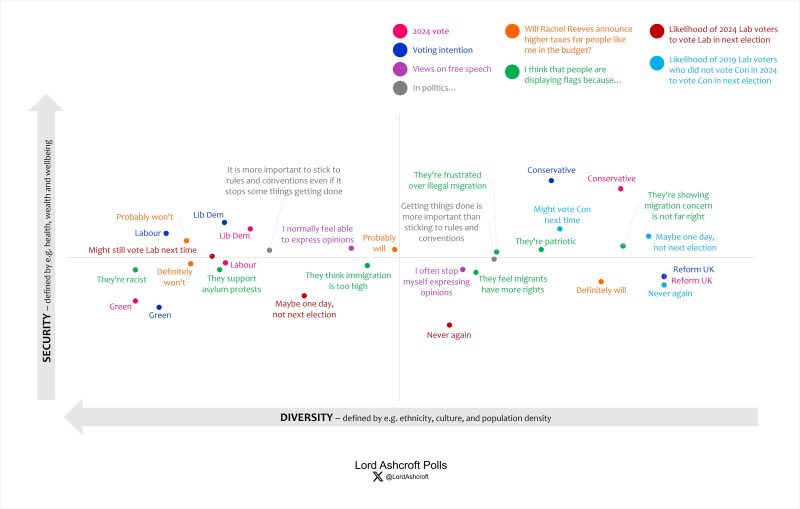
As above, our political map shows how different issues, attributes, personalities and opinions interact with one another. Each point shows where we are most likely to find people with that characteristic or opinion; the closer the plot points are to each other the more closely related they are. For example, we can see that those who feel comfortable expressing their opinion on controversial issues are most likely to be found in the more prosperous and diverse Labour-leaning top-left quadrant, while those who often feel they have to stop themselves saying what they think are most likely to appear in the less well-off, less diverse, Reform-leaning bottom right. We also see the distribution of opinion as to what is behind the display of Union and St George’s flags – with those who think those doing it are racist, supporting asylum protests or think immigration is too high in the left-leaning side of the map, and those thinking the flag displayers are frustrated at the failure to control illegal migration, simply patriotic, or trying to show that concern over migration is not far-right on the opposite side. Among those who voted Labour in 2024 but currently do not say will do so next time, those who say they may go back to the party at some point are most likely to be found closer to the Labour centre of gravity; those who say they will never vote Labour again are most likely to appear in bottom right, possibly red wall territory. Those who say that in politics it is more important to follow rules and conventions are most prevalent in Labour and Lib Dem territory, while those who say that getting things done matters more are most likely to be found on the right-hand side of the map.
Full data tables at LordAshcroftPolls.com
![Scott Bessent Explains The Big Picture Everyone is Missing During the Shutdown [WATCH]](https://www.right2024.com/wp-content/uploads/2025/11/Scott-Bessent-Explains-The-Big-Picture-Everyone-is-Missing-During-350x250.jpg)